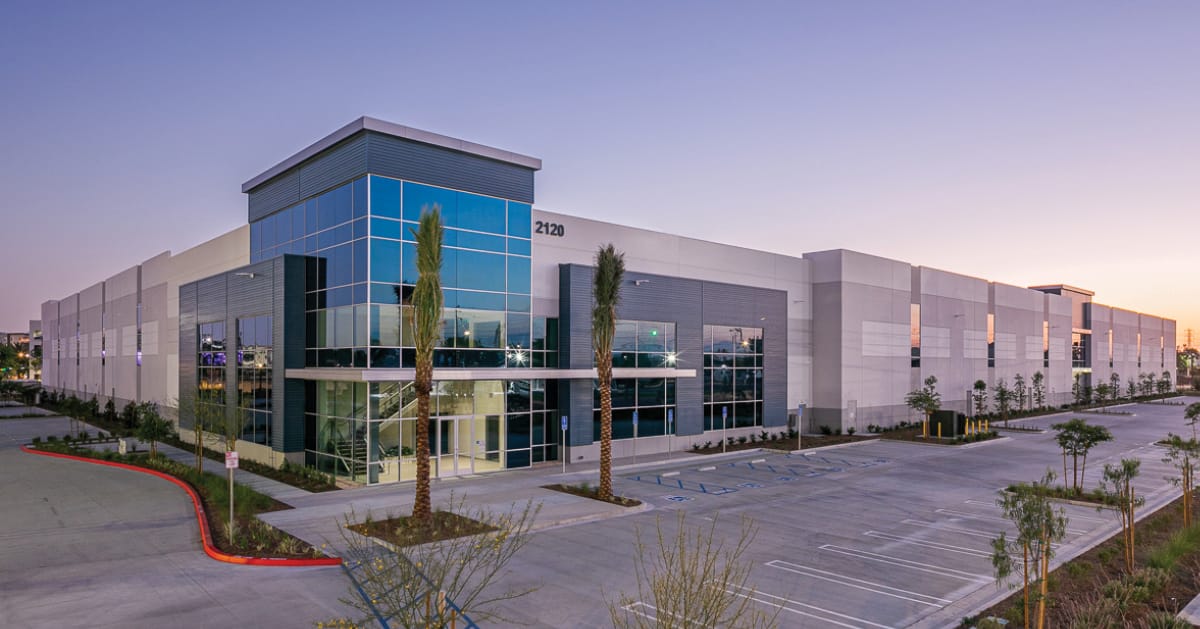
If you had to describe the industrial market in one word, it would be “bifurcated,” at both the national and SoCal levels. According to Voit’s market reports and data from CoStar, leasing activity is heavily concentrated in buildings between 25,000–50,000 SF and over 500,000 SF. The recovery also varies widely from market to market.
“Nationally, demand is extending beyond the newest warehouses into older buildings larger than 500,000 square feet, while midsized buildings still face excess supply and elevated competition for tenants,” said Juan Arias, national director of industrial analytics at CoStar Group.
That leasing momentum in larger facilities extends to the SoCal market. “An older industrial building in a superior location, with the right functionality, can be more valuable than a newer building that doesn’t meet the needs of users,” writes Tom Terry, Vice President in the Anaheim office, in his analysis of the Orange County market. “In Orange County, where land is limited and well-located industrial properties are difficult to replace, those fundamentals matter.”
CoStar pegs the national industrial vacancy rate in the mid-7% range, and all SoCal markets except the Inland Empire are at or below that level, with Orange County and Los Angeles County nearly 200 bps below the national figure. Average annual rent growth over 2026-27 is predicted to be 1.9%.
Here are some highlights from our Q3 industrial market reports.
Inland Empire
 Despite recording the highest vacancy rate among the markets we track, there are encouraging signs for the Inland Empire. The quarter saw 3.2 million SF of positive absorption, along with increased sales and leasing activity. The total vacancy rate remained virtually unchanged from Q3 last year, dropping slightly from 8.97% to 8.81%, while the availability rate rose 80 bps to 12.98% year over year. Sublease space remains high, with 15.3 million SF available at the end of Q3, although the total has decreased from the recent peak of 18.4 million SF in Q3 2025.
It remains a tenant’s market, with the average asking rate steadily declining since peaking in 2022, down by roughly one-third, and now sits at $0.98. To entice tenants, landlords are offering more generous concessions, including increased rental abatement and phased occupancy. But Ryan Clayton, Vice President in the Ontario office, cautions that favorable tenant conditions may soon shift, particularly if absorption holds at its current pace into 2027. There has been a pronounced slowdown in new construction. Only 2.4 million SF was delivered through the first three quarters of 2026, and the development pipeline has slowed to just 8.4 million SF under construction. The IE is on pace for its second consecutive year of decreased deliveries, and the first year in over a decade of less than 10 million SF in new deliveries.
“Tenants shouldn’t read today’s terms as permanent,” cautions Clayton. “The deals getting signed right now lock in rents and concession packages that could look generous in two years. For a 100,000 SF to 300,000 SF user, finding the right building, negotiating the lease, and completing improvements can easily take 12 to 18 months. A company with a 2027 or 2028 expiration that waits for the market to tell them it’s time will likely be reacting to tighter conditions instead of using today’s leverage.”
Sales volume also rose in the third quarter, with $1.5 billion in building sales, the highest quarterly total in three years, although large portfolio sales drove much of the volume.
Los Angeles
 In contrast to the Inland Empire, LA County sports the lowest vacancy rate in the SoCal markets. At 5.33%, LA is roughly 200 bps below the national average, virtually unchanged from Q3 2025’s rate of 5.41%. Despite low vacancy, the market recorded negative net absorption of 526,709 SF, as move-outs outpaced move-ins, although year-to-date net absorption remains positive at 2.8 million SF. Separately, nearly 1 million SF of new deliveries added to vacant supply, nudging the vacancy rate up from 5.20% in Q2. The average asking lease rate fell 3.3% year over year to $1.37 but is nearly 27% lower than the Q3 2023 asking rate of $1.88. In addition to asking rents decreasing, concessions remain elevated, especially in older buildings. Aerospace, advanced manufacturing, and logistics users in particular drove much of the leasing activity, including International Cargo Terminals (338,936 SF), CODA Logistics & Distribution (211,446 SF), and AMP Logis (200,000 SF). Sales activity was cut roughly in half between 2022 and 2024, due in part to the doubling of mortgage interest rates, but also the impact of the Measure ULA transfer tax, which can add 4.5% to 5.5% to the cost of a sale.
“Throughout 2026, fundamentals have stabilized as leasing activity has increased, tenant demand has strengthened, and industrial users have remained focused on securing strategic locations predominantly near the Ports of Los Angeles and Long Beach,” wrote Kevin Fults, Vice President in the Los Angeles office, in his market assessment. “While tenants now possess greater negotiating flexibility than in previous years, strengthening leasing fundamentals, increased investment sales activity, and growing demand from industrial occupiers are creating compelling opportunities for owners and investors alike.”
Orange County
 Similar to LA County, Orange County’s vacancy rate remains well below the national average at 5.64%, down 1.4% from Q3 2025’s 5.72%. Buildings under 75,000 SF have fared even better, recording the lowest vacancy rates, between 1.86% and 4.06%, compared with 8.69% to 10.68% in buildings of 75,000 square feet and larger.
The market rebounded from negative net absorption of 237,674 SF in Q2 to positive net absorption of 870,309 SF in Q3. Like LA, much of the leasing activity was driven by defense and aerospace manufacturers. Anduril expanded its footprint in the county, leasing 136,612 SF in Irvine and moving into 201,645 SF at the Lake Center campus in Santa Ana’s Airport Area submarket, a build-to-suit it committed to in Q1 2025.
The average asking lease rate continued its slow but steady decline, down to $1.44 from $1.48 in Q3 2025 and 15% below $1.70 in Q1 2024, although buildings with greater power leased to manufacturers achieved significantly higher rents. Landlords continue to include free rent in deals, averaging 2.73 months on a typical 62-month lease. While leasing is largely consistent with Q3 2025 figures, asking sale prices declined 14.3% year over year from $383.61 per SF to $328.91.
In his Orange County analysis, Tom Terry emphasized that the market has become more balanced and suggested that, given the market conditions, it may be a good time for landlords to evaluate their properties for competitiveness.
“What makes your building desirable to a tenant or buyer? Are there deficiencies that could make it harder to compete? And if you are going to invest in property, are you spending money on the improvements that matter most to users in the market?” he writes. “A good broker with a deep understanding of the market can help answer those questions and provide insight into how a property compares to competing buildings and what tenants and buyers are looking for.”
San Diego
 Despite the San Diego market posting positive net absorption in both Q3 and 2026 year to date (over 1 million SF through three quarters), vacancy and availability rates both increased incrementally from Q3 last year. The vacancy rate rose slightly to 7.49% from 7.22%. The availability rate increased to 10.35% from 9.73%—its highest level since Q1 2014—largely due to speculative construction with minimal pre-leasing. Average asking rates continued to decline, dropping to $1.38 from $1.41 in Q3 2025, and down from $1.52 at the close of 2023. It’s still very much a tenant’s market, with free rent and introductory promotional rates up significantly.
On a positive note, leasing activity had increased at the end of 2025 and into 2026, and new construction is below 1 million SF for the first time in a decade. In his analysis of the San Diego market, Associate Carter Shannon writes, “San Diego’s industrial market is starting to find its footing… Tours are up, tenants are making decisions again, and the conversations we are having with owners are less about how far the market will fall and more about how to position for what comes next.”
Mid Counties
 Vacancy and availability rates both increased year over year in the Mid Counties market, with vacancy rose 4.66% to 6.31% and availability was 10.31% up from 8.81%, for a nearly 17% increase since Q3 2025. Net absorption was negative 392,801 SF after positive net absorption of 124,458 SF in Q2, leaving the market with negative absorption of 247,070 SF through Q3 2026, compared with a positive 437,590 SF through Q3 2025. Average asking lease rates continued to decline, down from $1.40 in Q3 2025 to $1.26, with two leases of 100,000 SF or more averaging $0.98. We expect asking rents to continue softening before stabilizing, while free rent and tenant improvement allowances will remain part of most deals.
On the sales side, three transactions over 100,000 SF occurred in the Santa Fe Springs submarket in the quarter, with two properties acquired by owner-occupiers. Travelers Club Luggage purchased a 150,548 SF distribution center for $51.25 million, and Juanita’s Foods acquired a 112,096 SF manufacturing facility for $27.25 million.
For a deeper dive into the individual markets, visit the Voit Market Reports page. To learn more about how we can assist you with your commercial real estate needs, contact one of Voit Real Estate Services’ trusted commercial real estate advisors.