Industrial Markets at Midyear: Some Good News for Tenants
Despite a continued downturn in the industrial market as we enter the dog days of summer, there’s also some good news in the near term — as long as you’re a tenant seeking to renew or relocate.
Across all metrics, the industrial market continues to slow nationally and in the SoCal markets. Leasing and sales volume remain sluggish. Net absorption is approximately 15% below the pre-COVID 5-year national average. Vacancy continues to increase (6.5% nationally, according to Moody’s Analytics, a 120-bps increase since Q2 2023). The rise in average asking and effective lease rates has either slowed or just decreased in most markets.
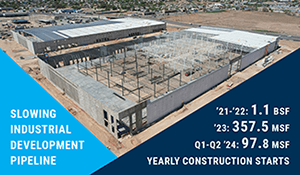
But the news isn’t all bad for owners and investors. One of the most significant contributors to the elevated vacancy levels in the last couple of years has been the surge in new industrial supply. Following two years of record-level deliveries, the industrial development pipeline has finally begun to slow, as deliveries have outpaced starts for six straight quarters. More than 1.1 billion square feet of construction began between 2021 and 2022, but starts fell to 357.5 million last year, according to CommercialEdge. Through the first six months of 2024, only 97.8 MSF have broken ground. By comparison, there were 313 MSF of construction starts in the first half of 2022.
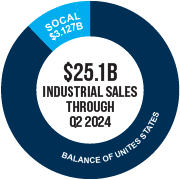
There are also encouraging signs on the sales front. Despite lingering high interest rates, the slowdown in rent growth, and the increase in vacancy, industrial sales increased from $21.2 billion at an average sale price of $129 PSF through Q2 2023 to $25.1 billion through the first half of the year, with properties trading at an average of $139 PSF. Southern California markets attracted an outsized portion of the investment pie, with Los Angeles County (#3, $1.58 billion), the Inland Empire (#6, $893 million), and Orange County (#11, $651 million) near the top of the list.
More good news may be on the way, as a report from Reuters stated that traders predict the Fed will deliver a half-percentage-point rate cut at its September 17-18 meeting and keep reducing borrowing costs with two more cuts. The policy rate is expected to end 2024 at least a full percentage point below where it is now, which should stimulate sales activity.
SoCal Industrial Markets Snapshot
The overall Southern California industrial market remains on a downward trajectory. As stated in our last blog post, vacancy rates in the Southern California markets tracked by Voit have essentially doubled year over year. However, most remain relatively low compared to the rest of the U.S. in Q2 – ranging from 4.18% in Orange County to 6.76% in the Inland Empire (a clear outlier). Leasing and sales activity vary from market to market, with absorption numbers heavily affected by construction delivery levels within a given market. Investment activity and owner/user sales remain sluggish overall due to high mortgage interest rates and elevated sales prices. And although the SBA 504 loan rates dropped to 6.35% in June from 6.69% in April, it hasn’t been enough to ignite a robust owner/user sales market. In addition, many players are reluctant to initiate active requirements until the upcoming election is done, as commercial property owners are wary of the potential for tax hikes.
Below is a snapshot of each market. For a more detailed analysis, visit our Market Reports page and select your market. You may also contact the broker(s) who authored each report by clicking on their names below. In each report, you will find up-to-date leasing and sales data, the largest lease and sales deals recorded for the quarter, vacancy and availability rates for each submarket, market forecasts, and a boots-on-the-ground view of the market by one of our market experts.
Inland Empire
Juan Gutierrez, SIOR, EVP/Partner and Ian Ozemic, CCIM, Senior Associate
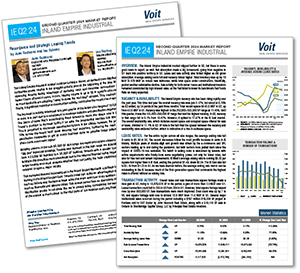
Although the vacancy rate doubled YOY from 3.17% to a regional high of 6.76% and availability hit double figures (11.10%), there were some positive signs in the Inland Empire. Net absorption went from negative in Q1 to positive in Q2, and gross absorption grew YOY from 9,432,464 to 13,878,578. Lease activity increased by 2.0 MSF over Q1. There were fewer lease transactions in the quarter, but total square footage leased rose by over 660,000, powered by a pair of 1M+ SF leases in the Fontana submarket.
Total square footage under construction declined in Q2, dropping to just under 16 MSF in a market that has previously averaged 27–33 MSF, which should slow the recent rise in vacancy. Gutierrez and Ozemic report that the market may be turning a corner as demand from distribution companies is growing. “We’re observing tenants taking advantage of declining rents and favorable concessions that haven’t been offered in years.”
Orange County
Mike Zehner, SVP/Partner and Reed Rutter, Associate
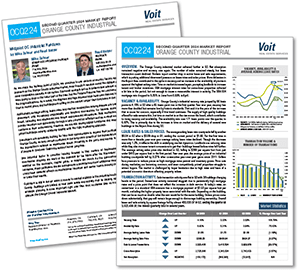
Despite a doubling of the vacancy rate YOY in the market, it remains (4.18%) the lowest of the five Voit markets. Lease and sale requirements have decreased, putting additional downward pressure on lease rates and sales prices. Landlords are reducing rates and increasing tenant concessions to get their buildings leased before rates fall further.
Unlike some markets, spec construction increased in Orange County in Q2. Over 771,000 SF was delivered, with just over 280,000 SF pre-leased. The current construction queue stands at 2,271,062 SF, up from 1,744,000 SF in Q1. The vacancy rate is expected to increase throughout the year, as lagging lease and sale activity will increase marketing time.
However, according to Zehner and Rutter, there is still an air of optimism. “We are still seeing highly functional and reasonably priced buildings moving relatively quickly with the right marketing approach. … Buildings are trading at near-peak levels, and activity may be picking up. Long-term strategic planning is more important right now than ever.”
San Diego
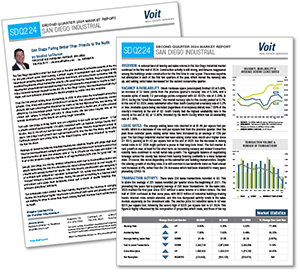
While the San Diego industrial market has traditionally been one of the best-performing markets in the country, it has seen negative absorption for seven of the last eight quarters. San Diego and Los Angeles counties were the only two of the five markets where vacancy rates did not double. Unlike Los Angeles, the San Diego asking rental rates have remained unchanged from Q2 2023. There has been an increase in leasing incentives, as some spaces are seeing longer downtime. Despite the slowing growth of starting rates, it is still common to see landlords insist on fixed annual rent increases of 4%.
On the sales side, 2023 marked the first year since 2017 without a sales volume of a billion dollars. The first half of 2024 continued at that same pace, with $423 million of industrial buildings trading hands. Interest rates remain elevated, dampening activity levels in the sales market, especially on the investment side.
“Overall, San Diego is a strong, healthy industrial market due to its diversified tenant base and limited supply. … The market is returning to a balance point where tenants and buyers once again have bargaining power and a choice of quality buildings that will help them increase operational efficiency,” Lachance reports.
Mid Counties
Dan Berkenfield, SVP/Partner and Rachel Burney, Associate
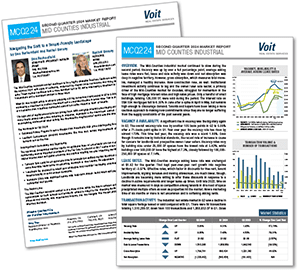
Vacancy has nearly tripled in the Mid Counties market YOY (1.85% to 5.06%), increasing by over 100 bps from Q1 to Q2. Negative net absorption in Q2 increased to 1,006,462 SF from 646,454 SF in Q1, continuing a trend since Q2 last year. Vacancy rates for properties under 25,000 SF are the lowest at 3.42%, while buildings over 500,000 SF have the highest at 7.3%. Asking rates have dropped slightly YOY, but effective rates are considerably lower. Landlords are countering with free rent, tenant improvements, signing bonuses, and moving allowances. Further weakening the outlook for landlords is that, unlike most SoCal markets, ground-up construction activity rose in Q2, from 370,787 SF in Q1 to 577,832 SF today. Sales activity was also sluggish, with only nine sales totaling 126,025 SF, a significant drop from Q1’s 14 sales totaling 376,746 SF and well below the Mid Counties typical 20–30 sales per quarter.
“While the future remains uncertain, there are opportunities for both tenants and landlords willing to adapt to the changing landscape. By staying informed and working with experienced brokers, you can navigate this market shift and make more informed decisions,” according to Berkenfield and Burney.
Los Angeles
The Los Angeles industrial market continues to slide, with vacancies continuing to increase and negative net absorption nearly tripling from Q2 2023. Average asking and effective lease rates have seen a precipitous decrease, from $1.88 in Q2 2023 to $1.58 today — the first time since the Great Recession that the year-over-year average asking lease rate is down. On the sales front, transactions fell to 55, the lowest number of quarterly sales transactions in more than three years. In addition to higher interest rates, sales are being impacted by the Measure ULA transfer taxes in the City of Los Angeles, where property owners face 4.5% to 5.5% tax on the sales price.
There was one positive note for landlords: construction fell significantly in Q2, ending with 3,690,156 SF in the queue, down from 5,459,653 SF in Q1.
Visit the Voit Market Reports page to read the reports for the Retail, R&D, and Office markets.


