How’s the Office Market Doing? Short Answer: It Depends…
While national office market forecasts predict stabilization in 2026, individual building performance is expected to diverge sharply by asset quality and location. That’s the assessment of much of the nation’s brokerage community, which emphasizes that this bifurcation doesn’t just vary from market to market — it’s building-by-building.
“What once behaved as a single asset class has fractured into distinct trajectories based on location, asset quality, tenant profile, and capital structure,” writes Chris Drzyzga, SIOR, Senior VP/Partner of the Voit Irvine office, in his market analysis in the Orange County office market report. While that report focuses specifically on Orange County, the sentiment applies nationwide: “The narrative is no longer about recovery versus distress, but about viability versus obsolescence.”
This trend has fueled a “flight to quality,” in which premium, highly amenitized spaces outperform older, commodity buildings — many of which are nearing functional obsolescence. One key component for increasing occupancy rates for landlords of Class A properties has been a focus on hospitality-level amenities. In recent years, office amenities have been shifting from “nice-to-have” perks to essential drivers of occupancy. These include health and wellness initiatives (onsite gyms and healthy food options), collaboration spaces, quiet zones, technology-enabled meeting rooms, sustainability features (green certifications such as BREEAM, LEED, WELL), and hospitality-like convenience services (daycare, concierge services). While these amenities require increased investment on the part of the landlord, multiple studies indicate that this investment increases ROI through double-digit rent premiums and higher tenant retention, as tenants can use their space to attract and retain high-quality talent.
The Big Picture
On a national scale, vacancy has peaked, and occupancy is increasing, according to a January 2026 National Office Report by Yardi Matrix. The national vacancy rate peaked in March of last year and has since fallen 150 basis points to its current rate of 18.4%. Seventeen of the top 25 metros saw vacancy rates decrease throughout 2025, but others saw significant increases. Manhattan, San Francisco, the Bay Area, and Houston all saw vacancy reductions of 300 bps or more, while Orlando (+310 bps), Nashville (+140 bps), and Washington, DC (+120 bps) all experienced increases. In Southern California, Orange County saw a 152 bps year-over-year drop in vacancy, while San Diego saw a 161 bps year-over-year increase, according to Voit Q4 2025 Office Market reports.
The national average full-service equivalent annualized listing rate was $32.86 per square foot ($2.74 per month) in December 2025. On the sales side, “Yardi Matrix recorded $53 billion in office sales through the end of December, with properties trading for an average of $192 per square foot.”
Return to Office Gaining Momentum
As firms adjust to the new normal of a hybrid workforce, office utilization is steadily increasing. Placer AI, which analyzes foot traffic data from 1,300 top-tier office buildings across the country, reported that “November 2025 delivered the strongest nationwide office occupancy for any November since 2019, with average visits per working day reaching a five-year high” — although regional patterns diverged. Average office visits per working day in November were 32.9% below November 2019 levels, the smallest gap recorded since early 2020.
The office utilization numbers are likely to increase in 2026 as more companies mandate return-to-work (RTO) policies. Newsweek reported that “a number of large companies are tightening in-office requirements in 2026, rolling back work-from-home arrangements and the ‘flexible’ ethos that took hold during and after the Covid pandemic.” In the article, Newsweek cites “a ResumeBuilder survey of business leaders conducted in October, where nearly half of all companies will demand that employees be in the office at least four days a week next year, with 28 percent phasing out remote work entirely.”
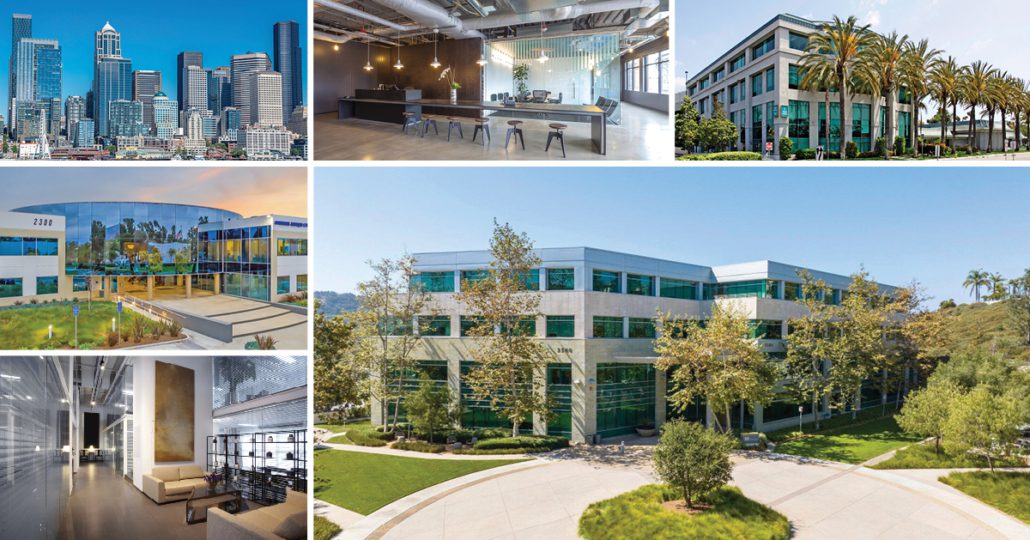
Southern California Office Markets
Voit tracks the San Diego and Orange County office markets, which are approximately 100 miles apart. The contrast between the direction of the two markets appears stark. Below is an overview of each market report, which includes an analysis by a top broker.
San Diego
 The direct vacancy rate remains well below the national average, but the overall San Diego office market is nearly 400 bps above its pre-COVID levels (10.13% in Q4 2019 versus 14.12% in Q4 2025). That number is greatly impacted by the 16-plus MSF Downtown market, which recorded a 35.8% vacancy rate for Q4 2025. Additionally, there were 1.6 MSF of new office deliveries in 2025, further inflating the figure. Some sizable submarkets are performing exceptionally well, however. At the close of Q4 2025, the vacancy rate for the 11.2 MSF Kearny Mesa in the central San Diego market was 8.93% (10.73% availability rate). The entire 8.4 MSF Southern & Eastern Areas market (excluding South San Diego, at 12.35% vacancy) has vacancy and availability rates in the single digits.
The average asking full-service gross (FSG) lease rate per square foot per month in San Diego County was $3.09 at the end of Q4, a 1.64% decrease from Q4 2024’s rate of $3.04. Our research indicates that there will be continued pressure on rental rates, with elevated vacancy levels not expected to improve significantly over the coming months, influenced by tenant flight to quality. “While some core areas and higher-quality buildings continued to attract tenants, a significant share of older or less desirable space struggled to find new occupants,” writes Jon Boland, Senior Vice President/Partner in the San Diego office, in his market analysis in the San Diego office market report. “Class A properties consistently showed stronger performance [in Q4] than Class B or C segments, reflecting a continuing ‘flight to quality’ trend.”
Orange County
 The Orange County office market has a higher vacancy rate than San Diego’s, but it is clearly heading in a positive direction. Strong leasing activity has reduced the year-over-year vacancy rate from 16.07% in Q4 2024 to 14.55% in Q4 2025 — a nearly 10% drop. As we stated in our opening, activity is focused on specific locations and buildings rather than spread evenly across the inventory, with higher quality Class A and strong Class B properties attracting most of the leasing activity. The market has also benefited from limited new construction and the removal or repositioning of some obsolete buildings. Another driver of the increased leasing velocity is landlords’ willingness to reduce asking rents, which moved steadily downward in 2025. Asking rents dropped by nearly 4% year over year, from $2.81 in Q4 2024 to $2.70 in Q4 2025.
Our researchers predict that the next year is likely to extend the stabilization pattern rather than deliver a sharp rebound. Vacancy is expected to edge lower as modest positive absorption combines with the continued removal or repurposing of obsolete buildings, keeping pressure on the most dated space while supporting better performance in upgraded product.
On the sales side, Drzyzga expresses optimism in his Orange County analysis, writing, “Buyers have largely come to terms with a higher interest rate regime and, importantly, many believe pricing has reached its floor. That combination has been elusive for much of this cycle, and as those signals further align, sales activity should pick up.”
For a deeper dive into the individual office markets, visit the Voit Market Reports page. To learn more about how we can assist you with your commercial real estate needs, contact one of Voit Real Estate Services’ trusted commercial real estate advisors.


